Atlas: The Living Blueprint.
Picture a single, living blueprint that covers your entire web app, built automatically. Every screen, every state, and every user journey - all in one place.
That's Atlas. It ensures every test plan, user story, and bug report is 100% specific to your app, not a generic guesswork, or AI slop.
Structural Knowledge
Understanding the "Places" within your application.
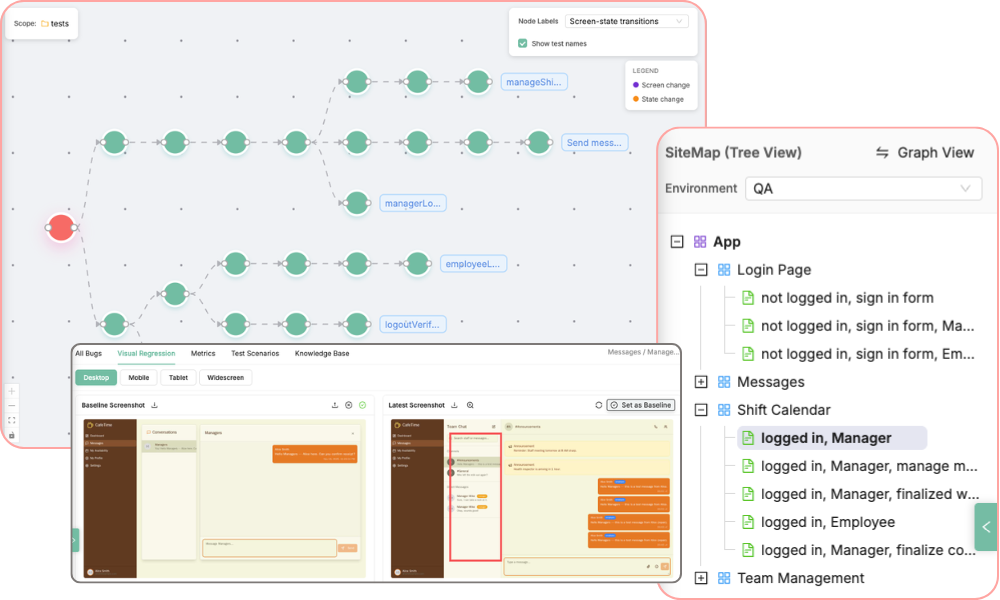
The Site Map
Your app's structural blueprint, built and updated automatically. Every time an Exploration runs, Atlas maps every screen and state (like 'Admin Dashboard' vs. 'Logged-out User') into an easy-to-understand hierarchy.
This isn't just a map; it's your command center.
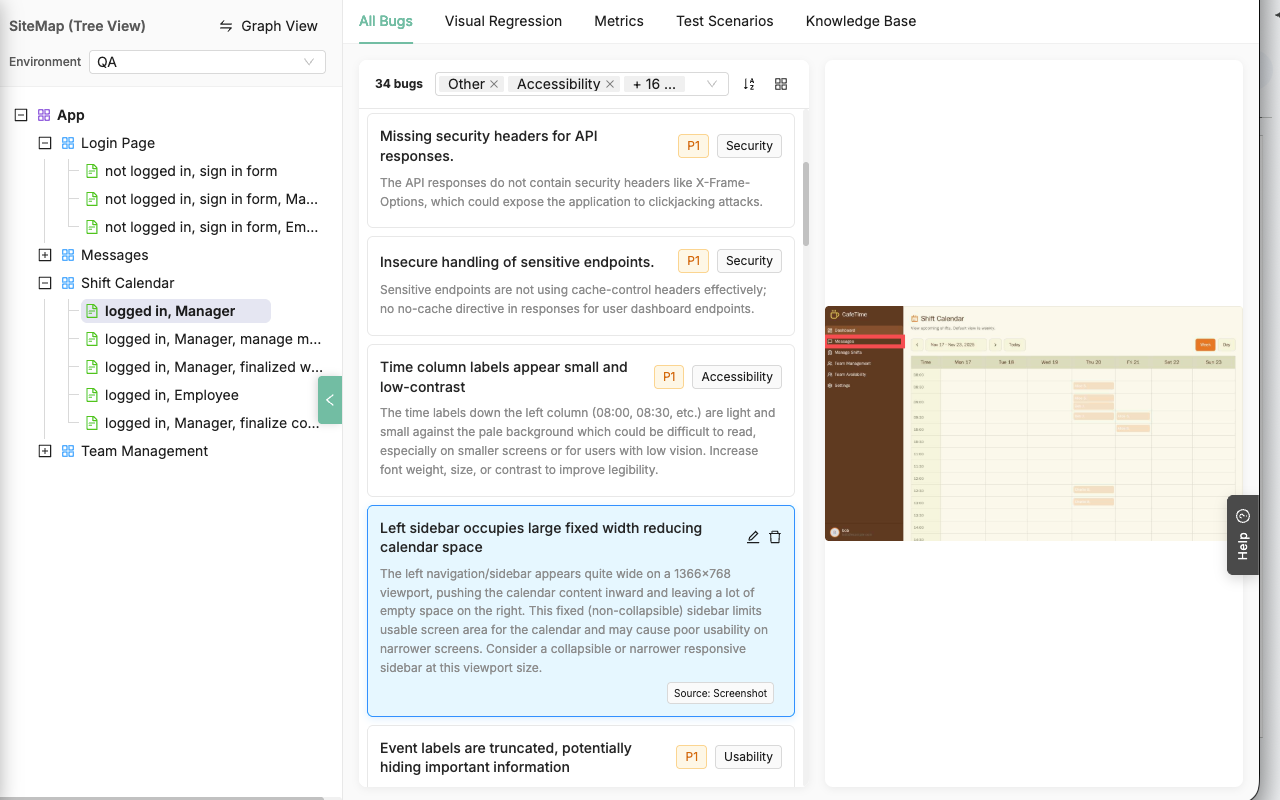
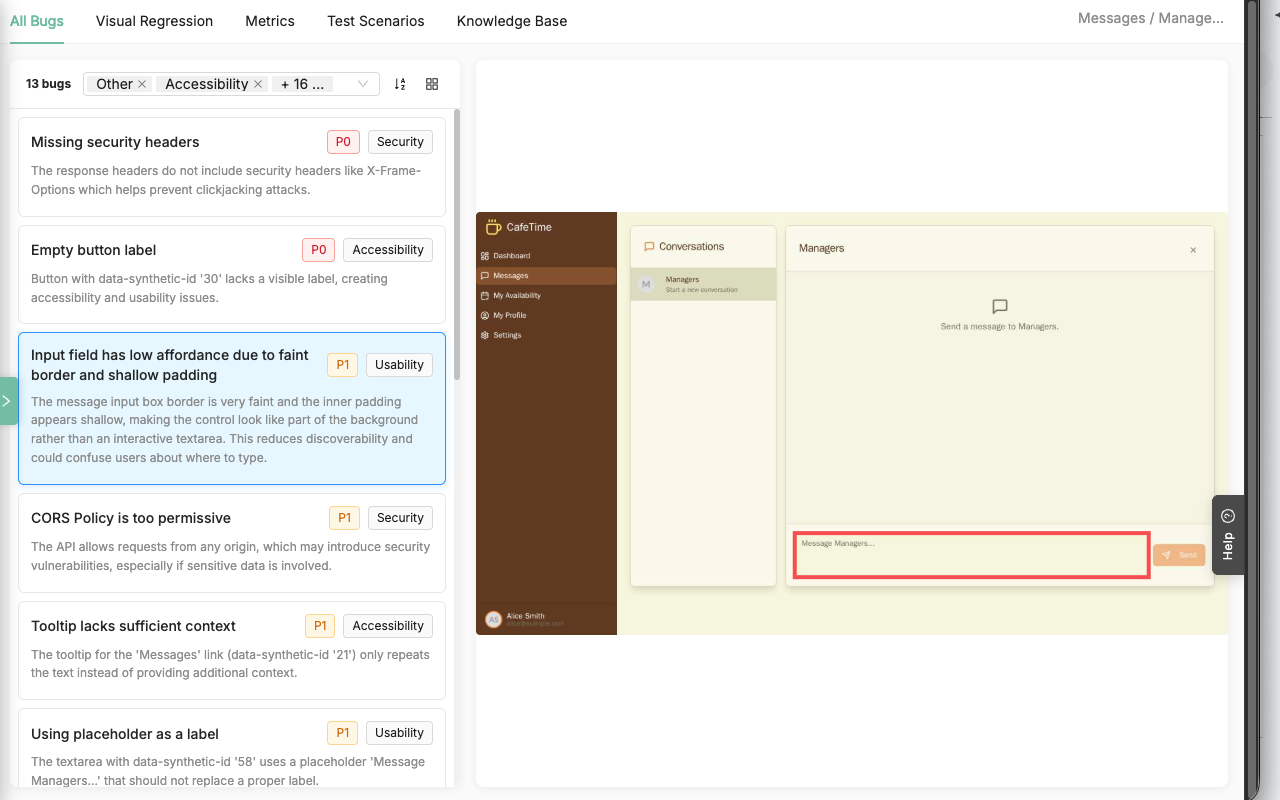
Organised Bugs
Bugs are no longer lost in a flat list. Atlas automatically analyzes and catalogs every issue—from the DOM, console, network, or screenshots—and pins it directly to the screen and state where it was found.
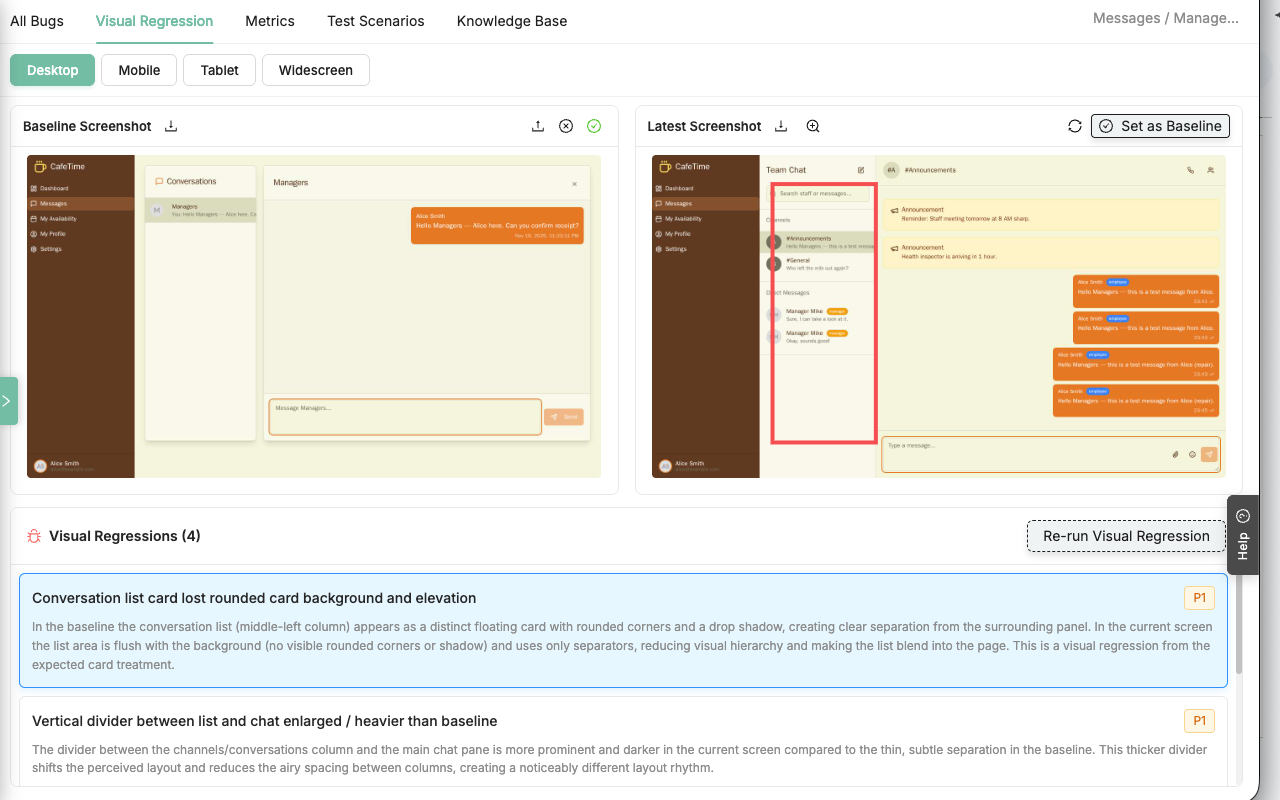
Visual Regressions
Stop drowning in false positives. Our context-aware engine compares new screenshots against an "approved baseline" for every screen-state to spot material regressions.
You can even upload a Figma design as your baseline to compare your plan directly against the final build.
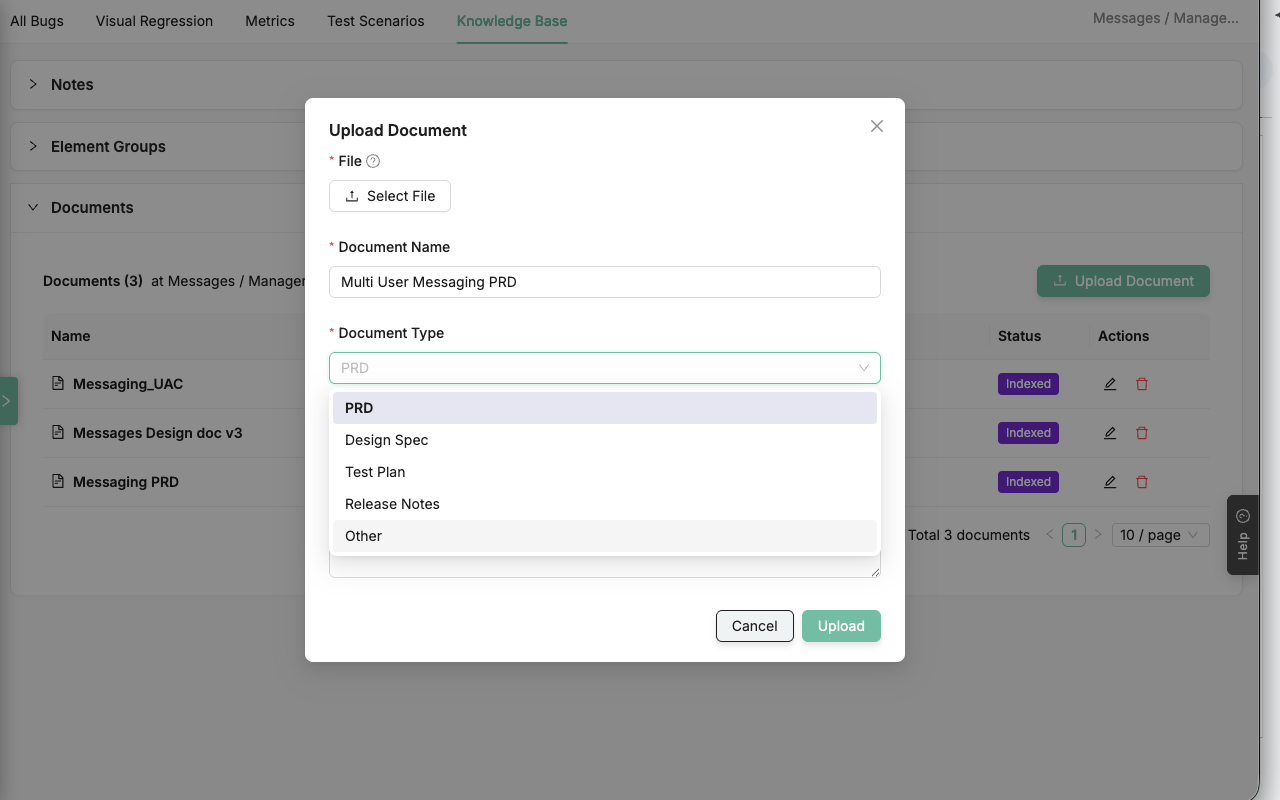
Smart Knowledge Base
A flat folder of PRDs isn't useful. Atlas lets you attach your docs—PRDs, specs, user stories—directly to the screen or feature they relate to.
When the AI writes a test, it retrieves the exact, relevant context for that specific part of your app.
Behavioural Knowledge
Understanding the "Pathways" through your app.
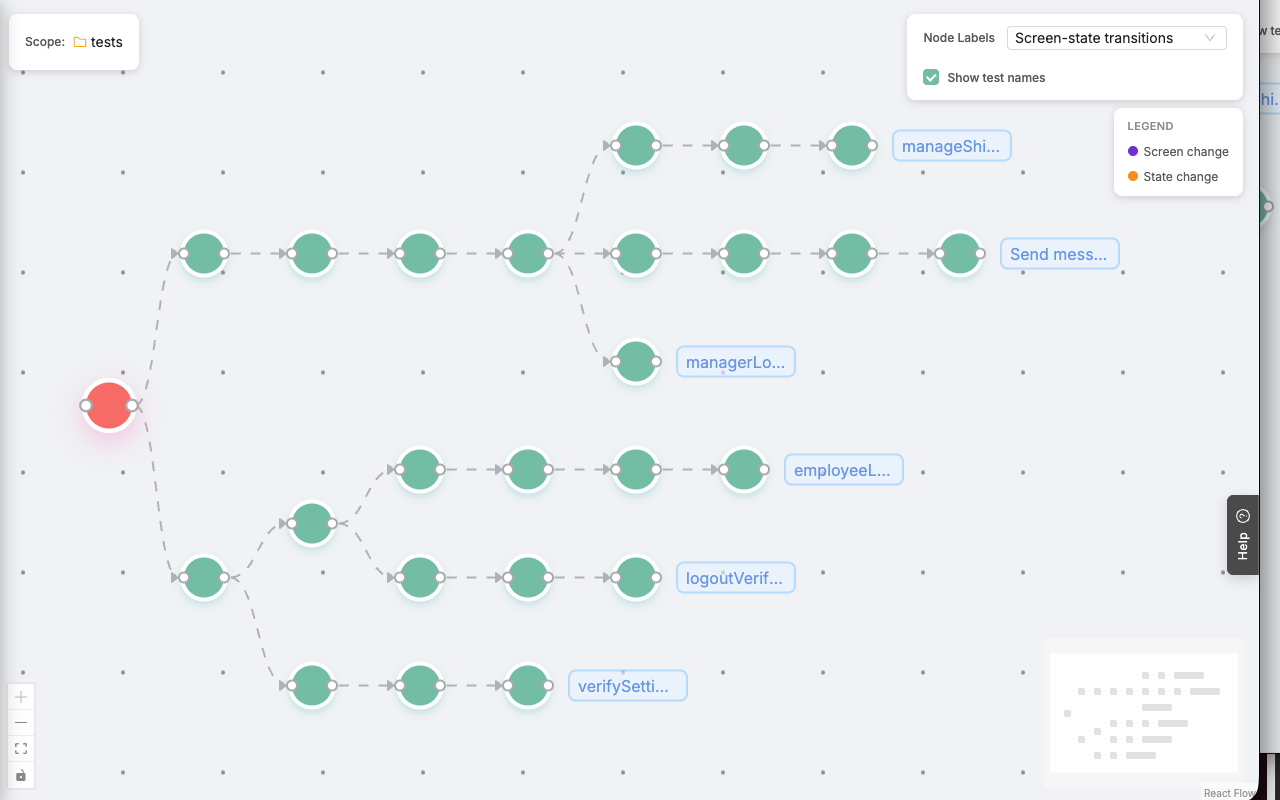
Visualize User Journeys
Stop thinking of tests as a flat list of files. The Behaviour Map renders your entire SmartTest suite as an interactive journey tree.
See your coverage, understand test flow, and pinpoint exactly where screen transitions (like 'Login' -> 'Dashboard') happen.
Expand the Test Suite
Find the "unhappy paths" you missed. Right-click any node in a journey and ask the AI to "Expand Test Suite."
The agent will navigate to that step, analyze the page for unexplored branches, and automatically generate a new test plan to cover them.
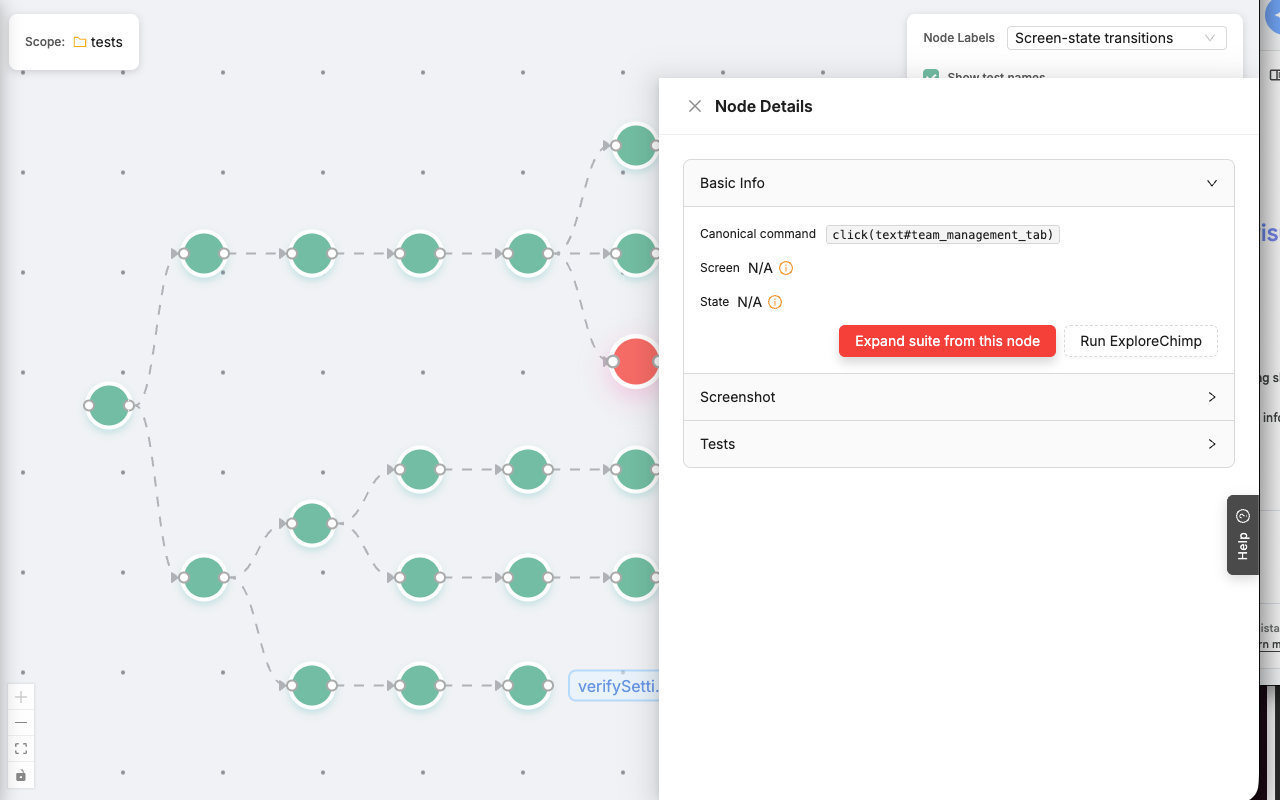
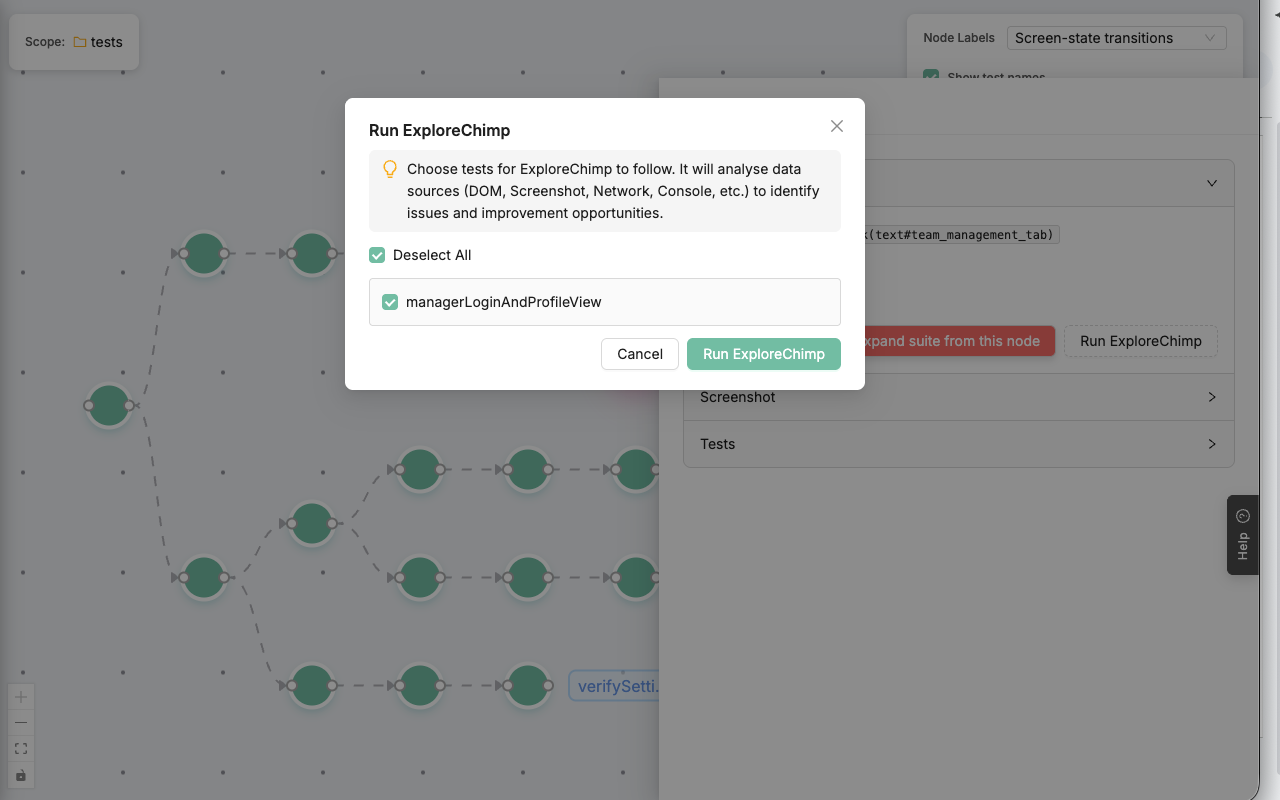
Run Hyper-Focused Explorations
Don't run your entire suite just to check one small change. Click on any node in a journey and select "Run ExploreChimp."
The agent will use that test as its guide, focusing its powerful analysis on one specific pathway.
FAQs
TestChimp “sees” your app. By analyzing screenshots of every state, the AI detects visual inconsistencies, layout breaks, and even accessibility issues (like poor contrast). It highlights these design flaws, acting as an automated design review that catches UX bugs functional tests often miss.
Atlas uses context-aware visual regression. It learns which parts of your page change frequently (like timestamps, user data, or ads) and intelligently ignores them, focusing strict comparison only on structural elements and layout.
Atlas identifies screens with abnormal load times or heavy asset requests. These performance anomalies are flagged on the node itself, helping you correlate specific UI states with performance degradation.
Our agent captures and analyzes deep browser performance metrics such as:
- CLS (Cumulative Layout Shift) – where janky content shifts occur
- INP (Interaction to Next Paint) – slow button responses, input lag
- Long Tasks – heavy JS blocking the main thread
- Large or unoptimized resource loads
- TBT (Total Blocking Time)
- Memory heap usage and leaks
- Network timing and caching misses
Atlas transforms your bug logs into a visual map. Instead of sifting through list-based reports, Atlas pins every console error, failed test, and network issue directly to the specific screen where it occurred on the Site Map. This allows you to instantly spot which features require immediate attention.
The Behaviour Map reveals the actual paths taken through your app, highlighting “dead ends” and circular loops where users (or the AI) get stuck. Additionally, the “Expand Test Suite” feature actively hunts for “unhappy paths” – edge cases and logical breaks that aren’t covered by your happy-path tests.
Atlas provides “Time-Travel” context. When a bug is pinned, you don’t just get the error; you get the full journey trace, the visual snapshot of the failure, and the console/network state at that exact moment. This allows developers to reproduce the exact conditions of the failure instantly.
Visual coverage is the only true coverage. The Site Map shows your entire application structure, while the Behaviour Map overlays the paths your tests actually cover. Any screen or state that appears in the Site Map but is not traversed in the Behaviour Map represents a gap in your testing strategy.