Everyone loves to talk about “building features” and “shipping fast.” But we rarely talk about the thing that silently kills conversions, frustrates users, and destroys retention:
Performance.
Not the “page still loads eventually” kind – but the slow, janky, slightly-off performance that users instantly notice and abandon your product for.
And the data is brutal:
- Amazon found that a 1-second delay in page load time reduced conversions by 7%.
- The probability of a bounce increases by 32% as load time goes from 1s → 3s.
- Apps that invest in performance optimizations see up to 30% higher retention.
Users don’t always tell you this directly, but every UX study confirms it:
Slow, sluggish experiences are one of the most complained-about frustrations – and a top reason users bounce.
But We Already Have Automated Tests… Isn’t Our App “Tested”?
This is the dangerous assumption teams make.
Yes, you may have automation test coverage.
Yes, your flows might “functionally work.”
But functional checks don’t catch:
- the button that feels slow
- the layout shift that makes the user misclick
- the subtle JavaScript bloat that accumulates over releases
- the screen that takes 1.2s longer than it used to
- the resource that takes long to load due to cache misconfiguration
- the memory leak that only appears after a few steps
These aren’t textbook “bugs,” so no one files them.
And because performance is subjective (“eh, feels a bit sluggish?”), rarely gets documented with hard numbers.
Result: regressions creep in release after release – until your retention chart quietly slopes downward.
Performance Bug Detection in TestChimp’s Exploratory Agent
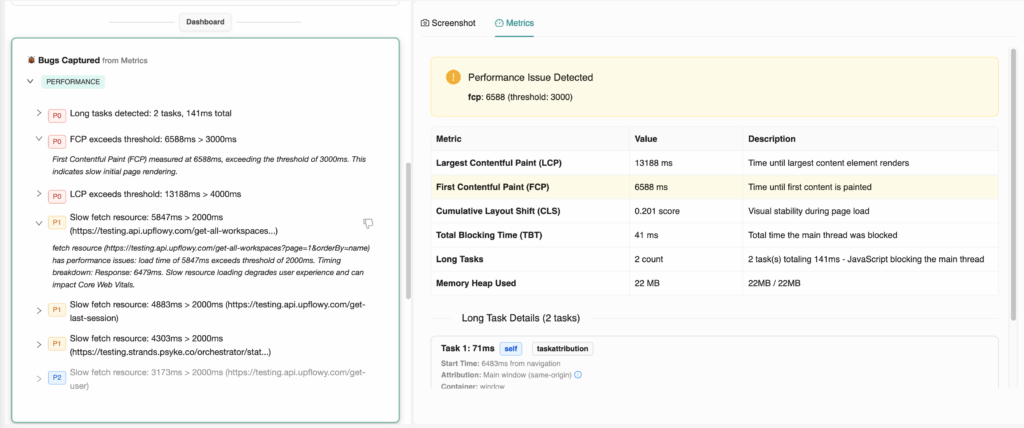
To fix this blind spot, TestChimp’s exploratory agent now automatically flags performance and memory issues – alongside the other usability bugs it catches.
And just like other bugs it finds, every performance issue is tied to the exact screen/state it appeared in.
You get a clear map of where your app slows down, why, and by how much.
No more vague complaints.
No more guessing.
Performance bugs, accurately tracked, and backed by hard evidence.
What the Agent Analyzes
The agent captures and analyzes deep browser performance metrics such as:
- CLS (Cumulative Layout Shift) – where janky content shifts occur
- INP (Interaction to Next Paint) – slow button responses, input lag
- Long Tasks – heavy JS blocking the main thread
- Large or unoptimized resource loads
- TBT (Total Blocking Time)
- Memory heap usage and leaks
- Network timing and caching misses
And more…
Combines this with Screenshot data to highlight:
- Which screens are causing frustration
- Which buttons are slow to respond
- Where layout instability is happening
- Which resources are dragging down load times
- Where caching is failing
Essentially:
The stuff that actually impacts user experience – and revenue – but never gets caught in ordinary test suites.
Why This Matters
Performance isn’t a “nice-to-have.”
It’s a direct business driver:
- Higher conversions
- Lower bounce rates
- Higher user trust
- Better retention
- Cleaner UX
- Higher SEO ranking
- Less app fatigue and frustration
By treating performance issues as first-class bugs, you’re not just “optimizing.”
You’re making your product feel premium and effortless, the way users expect modern webapps to be.